
We study the vulnerabilities that get discovered, the hackers who succeed, and the tools that produce impressive results. But what about everything that remains invisible?
1. The airplane that changed how we think about data
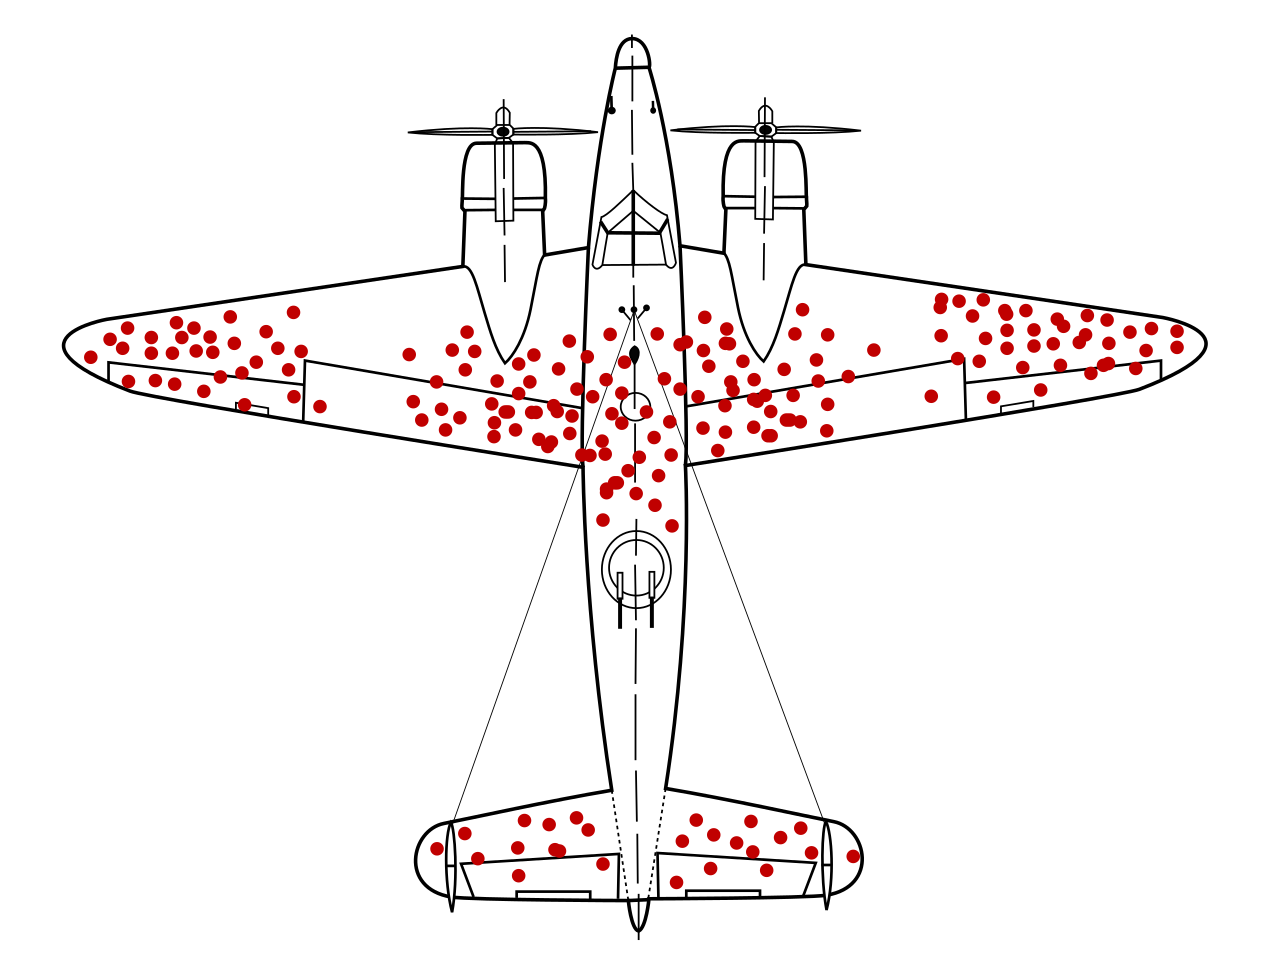
During World War II, military analysts wanted to understand how to make aircraft more likely to survive combat missions.
They examined aircraft that returned from missions and mapped the bullet holes across their wings, fuselage, and other sections. The apparent solution seemed obvious: reinforce the areas that showed the most damage.
But statistician Abraham Wald approached the problem differently.
The aircraft in the dataset had something important in common: they had survived.
The aircraft that were shot down were absent from the analysis. Their damage patterns were unavailable for direct inspection in the same way as those of returning aircraft.
Wald recognized that the missing aircraft mattered. Damage in areas frequently hit on returning planes could often be survived. Conversely, areas with fewer observed hits could include critical locations where damage was more likely to prevent an aircraft from returning.
The correct question was not simply, "Where do we see the most bullet holes?"
It was, "How does the process of survival affect the damage patterns we observe?"
Wald developed statistical methods for estimating aircraft vulnerability from survivor damage. His work illustrates a principle that applies far beyond military aviation.
When the process that determines which observations survive also affects what we measure, analyzing only the surviving observations can lead to incorrect conclusions.
This is known as survivorship bias, a form of selection bias.
Historical sources
- A Method of Estimating Plane Vulnerability Based on Damage of Survivors — Center for Naval Analyses
- Mangel and Samaniego, Abraham Wald's Work on Aircraft Survivability, 1984
2. The same problem exists in bug bounty hunting
As security researchers, we learn from successful vulnerability disclosures.
We read reports about IDOR, broken access control, SQL injection, cross-site scripting, server-side request forgery, authentication bypasses, and business logic vulnerabilities.
These reports are valuable. They demonstrate real attack paths and provide technical details that can improve our methodology.
However, public vulnerability reports are not a complete record of everything that happens during security testing.
Consider what might be missing:
- A researcher spends 40 hours testing an application and finds no valid vulnerability.
- A vulnerability is discovered but reported as a duplicate of an existing finding.
- A submission is rejected because the issue is not reproducible or does not meet the program's security requirements.
- A valid vulnerability is fixed privately and never publicly disclosed.
- A security weakness remains undiscovered because nobody has tested the relevant functionality.
- A vulnerability is found but never reported because the researcher has no clear disclosure pathway.
These cases have different causes and implications. Yet they all demonstrate why a collection of successful public reports cannot automatically represent the full population of vulnerabilities.
Imagine finding 100 public reports, of which 60 concern broken access control.
It would be accurate to say that 60% of that particular sample concerns broken access control, assuming the reports were categorized correctly.
It would not automatically be accurate to claim that 60% of all critical web vulnerabilities are broken access control.
To make that broader claim, we would need a representative sample and a defensible understanding of the applications, tests, vulnerabilities, and reporting processes involved.
This distinction is essential: the distribution of published findings is not necessarily the distribution of underlying security weaknesses.
3. What published bug bounty data actually tells us
Fortunately, security platforms do publish useful aggregate statistics. These provide a stronger starting point than relying only on memorable individual reports.
The key is to understand both what the numbers establish and what they cannot establish.
Bugcrowd: changes in vulnerability findings
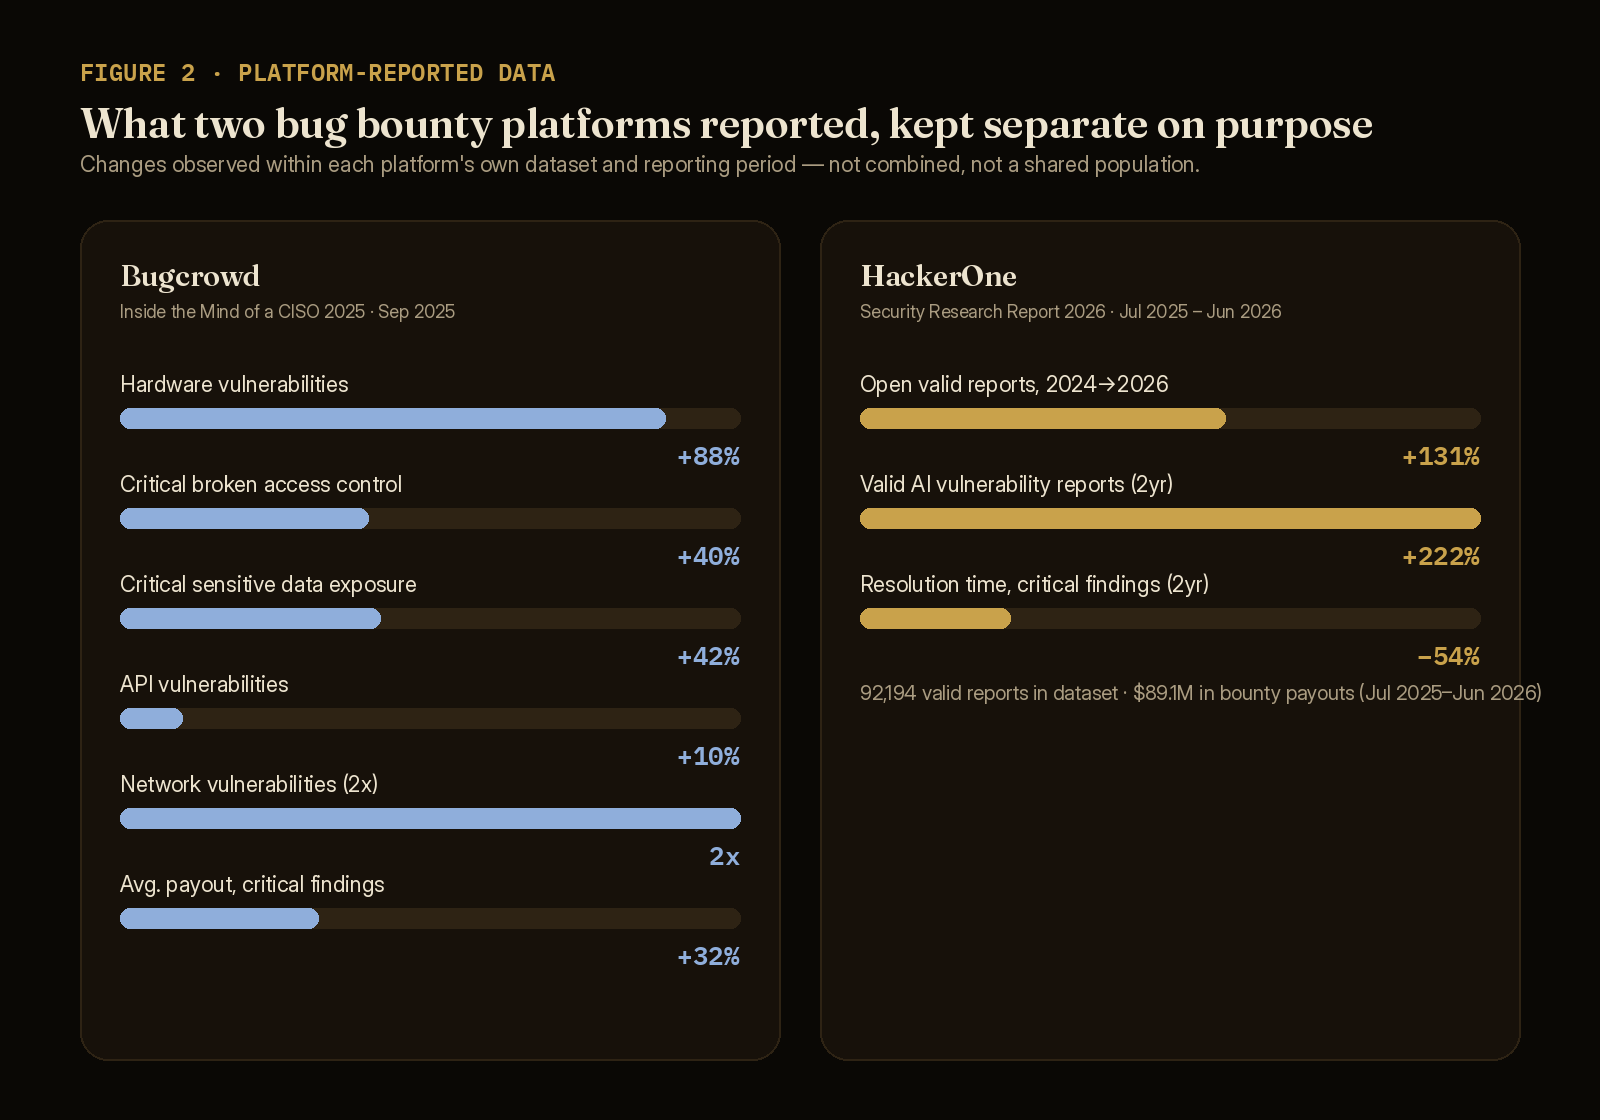
In its September 2025 announcement for Inside the Mind of a CISO 2025, Bugcrowd reported trends drawn from hundreds of thousands of vulnerability data points across thousands of public and private vulnerability disclosure and bug bounty engagements from the preceding year.
Its published findings included the following changes:
| Metric | Reported change |
|---|---|
| Hardware vulnerabilities | +88% |
| Critical broken access control vulnerabilities | +40% |
| Critical sensitive data exposure vulnerabilities | +42% |
| API vulnerabilities | +10% |
| Network vulnerabilities | 2×, or doubled |
| Average payouts for critical vulnerabilities | +32% |
Source: Bugcrowd, September 23, 2025.
These are meaningful observations from Bugcrowd's dataset. They suggest that the platform recorded increases in several categories of findings over the comparison period.
But they need to be interpreted carefully.
A 40% increase in critical broken access control findings does not, by itself, establish that the underlying prevalence of broken access control increased by 40% across all web applications.
The number of findings can be affected by several factors, including the number of engagements, the targets in scope, researcher activity, testing intensity, changes in classification, and the vulnerabilities that were actually present.
For example, a rise in findings could reflect a genuine increase in security weaknesses, an expansion in the number of systems being tested, better detection, or some combination of these factors.
The published percentage alone cannot isolate those explanations.
That is exactly why survivorship bias matters: even when a dataset is large and valuable, we need to understand the process that produced it before generalizing beyond it.
HackerOne: a larger view of disclosed security findings
HackerOne's 2026 Security Research Report provides another useful example.
The report draws on aggregated platform data covering July 2025 through June 2026, along with surveys of security leaders and active researchers.
According to HackerOne, the report includes:
| Published metric | Reported figure |
|---|---|
| Valid vulnerability reports in the report's dataset | 92,194 |
| Bounty payouts, July 2025–June 2026 | $89.1 million |
| Growth in open valid reports from 2024 to 2026 | +131% |
| Reduction in average resolution time, critical findings, over two years | 54% |
| Growth in valid AI vulnerability reports over two years | +222% |
Source: HackerOne Security Research Report 2026.
These numbers illustrate several important distinctions.
First, the 92,194 figure describes valid reports in the report's dataset. It is not an estimate of the total number of vulnerabilities that exist on the internet.
Second, the 131% increase in open valid reports shows a growing backlog of reported issues within the platform's reporting context. It does not necessarily mean the underlying vulnerability population increased by 131%.
Third, the reported 222% growth in valid AI vulnerability reports indicates a substantial increase in discovered and reported AI-related issues within the measured data. It does not prove that every AI system became 222% less secure.
Finally, the combination of faster remediation and a growing backlog is especially instructive. A system can improve one metric while still struggling with the broader problem.
This is a useful reminder that a single headline metric rarely captures the whole security picture.
YesWeHack: why methodology and context matter
YesWeHack's Bug Bounty Report 2025, published on January 14, 2025, draws on tens of thousands of vulnerability reports resolved during the preceding year, alongside interviews with customers, researchers, and platform teams.
The report covers common CWEs, bounty payouts, researcher leaderboards, triage perspectives, and open-source security.
Source: YesWeHack Bug Bounty Report 2025.
Its value is not simply in counting vulnerabilities. It also offers context about how reports are triaged, which weaknesses appear in the observed data, and how security programs operate.
However, a leaderboard of successful researchers is not a complete dataset of everyone who participated. Similarly, a breakdown of resolved reports does not automatically include every vulnerability that was tested for, missed, rejected, duplicated, or never reported.
These limitations do not make platform reports unreliable. They define what conclusions can reasonably be drawn from them.
4. The difference between findings and prevalence
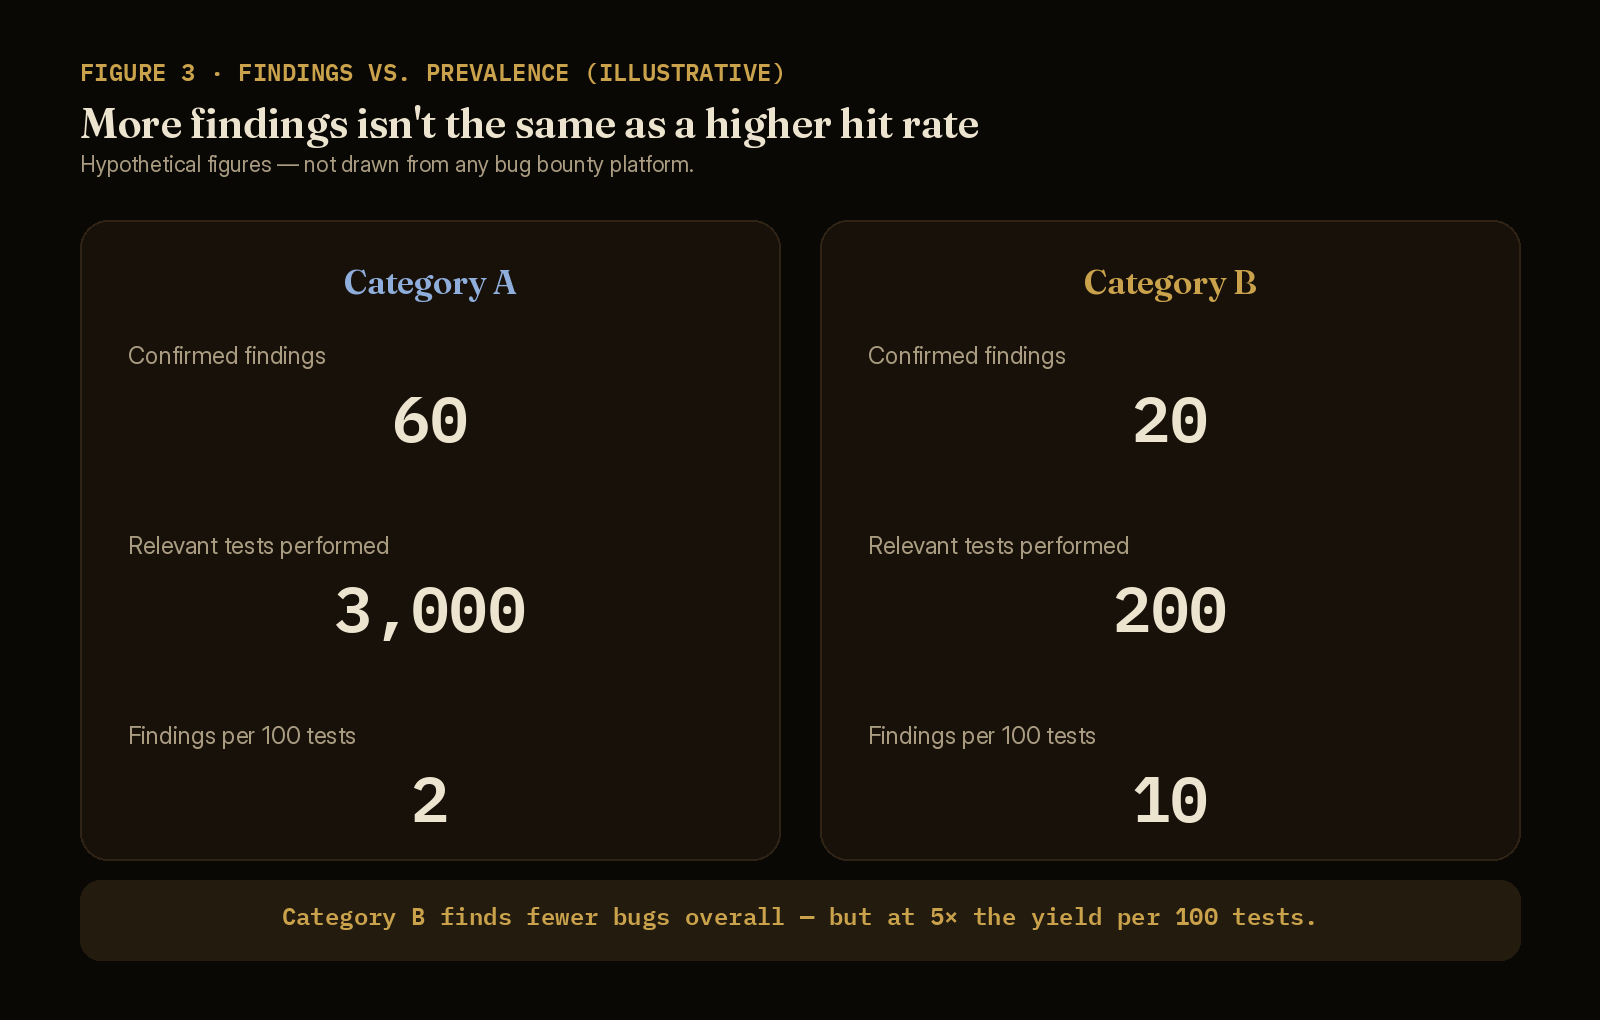
Consider two hypothetical vulnerability categories from a security testing program.
The following figures are illustrative and are not taken from any bug bounty platform.
| Measurement | Category A | Category B |
|---|---|---|
| Confirmed findings | 60 | 20 |
| Relevant tests performed | 3,000 | 200 |
| Findings per 100 tests | 2 | 10 |
Category A produces three times as many findings as Category B.
However, Category B has five times the observed yield per test.
Even this comparison does not prove that Category B is inherently more common or easier to exploit. The tests may differ in difficulty, quality, target selection, and coverage.
But it reveals why absolute finding counts can be misleading.
There are at least three different questions we might ask:
- What vulnerability types account for the largest number of reported findings?
- Which testing methods produce the highest yield under comparable conditions?
- Which vulnerability types are most prevalent across a defined population of systems?
These questions require different datasets and different methods of analysis.
A report-count dataset may help answer the first question. Carefully designed comparative testing may help answer the second. Estimating the third requires a defensible sampling strategy and sufficient information about the population being studied.
Confusing these questions is one way survivorship bias leads to bad decisions.
5. Survivorship bias in security tools and benchmarks
The same reasoning applies when comparing vulnerability scanners, recon frameworks, static analysis tools, and automated penetration testing systems.
Imagine a scanner reports 100 findings during an assessment. Another reports 30.
Which is better?
We cannot determine that from the counts alone.
The first scanner might have identified more genuine vulnerabilities. It might also have produced more false positives, duplicates, or low-value findings.
The second might have missed important vulnerabilities, or it might have been more precise.
A proper evaluation should measure at least:
- Precision: The proportion of reported findings that are genuine.
- Recall: The proportion of known vulnerabilities that the tool detects.
- False negatives: Relevant vulnerabilities that the tool misses.
- Coverage: The technologies, attack surfaces, and vulnerability classes it can examine.
- Reproducibility: Whether findings can be independently validated under comparable conditions.
Suppose a scanner detects 80 of 100 known vulnerabilities and produces 20 false positives.
Its precision is 80%, because 80 of its 100 reported findings are genuine. Its recall is also 80%, because it detects 80 of the 100 known vulnerabilities.
These are illustrative results, but they demonstrate why a benchmark should measure both detections and misses.
There is another potential source of bias: a benchmark may contain only vulnerabilities that researchers already know how to reproduce. It might underrepresent complex business logic flaws, multi-step authorization failures, or vulnerabilities that depend on a particular runtime environment.
A tool can perform exceptionally well on a benchmark while still having blind spots in production.
The solution is not to reject benchmarks. It is to examine their construction, coverage, and limitations.
6. What about AI security and agentic systems?
The same issue becomes especially relevant when evaluating AI agents, plugins, and agent skills.
Imagine evaluating a scanner against 100 known malicious skill samples. It detects 95.
That sounds impressive. But it establishes only that the scanner detected 95 samples in that particular test set, assuming the labels are correct.
It does not establish that the scanner detects 95% of malicious skills in the wild.
The test set might overrepresent obvious malicious instructions while underrepresenting behavior that emerges only during execution.
For example, relevant test scenarios might include:
- Skills that misuse tools or permissions.
- Malicious instructions retrieved from external sources.
- Behavior that depends on a particular sequence of agent actions.
- Unexpected interactions between multiple skills or MCP servers.
- Runtime behavior that differs from what a skill's metadata claims.
These are examples of possible blind spots, not claims that every scanner fails to detect them.
A static scanner and a runtime security assessment also measure different things. Static analysis can inspect declared instructions and code; runtime evaluation can reveal behavior that depends on execution context, tools, permissions, and external inputs.
A stronger evaluation would combine representative samples, known benign cases, explicit ground-truth labels, realistic runtime scenarios, and measurements of both false positives and false negatives.
It should also explain what has not been tested.
A high detection rate on a selected benchmark is evidence of performance on that benchmark — not proof of comprehensive security.
This is particularly important in emerging fields such as agentic AI security, where the set of known attack patterns is still evolving.
7. How to reduce survivorship bias in your research
We cannot always observe the complete population of vulnerabilities. Undiscovered bugs, unreported issues, and unavailable test results are often impossible to enumerate precisely.
However, we can improve the quality of our conclusions.
Start by understanding how the dataset was created
Determine whether the evidence comes from public disclosures, private engagements, a scanner benchmark, an intentionally vulnerable lab, or a production assessment.
Each source has its own selection process.
Look for the missing observations
Ask what is excluded from the dataset.
Are invalid and duplicate submissions recorded? Are unsuccessful tests available? Are undiscovered vulnerabilities represented through a ground-truth benchmark? Are untested assets counted?
The answers determine what the data can support.
Use meaningful denominators
Where possible, report findings relative to the relevant testing population.
Depending on the question, that might mean findings per application, findings per testing hour, detections per known vulnerability, or false positives per benign test case.
A denominator does not automatically eliminate bias, but it often makes comparisons more informative.
Compare equivalent conditions
When comparing two tools, test them against the same targets and vulnerability set under equivalent conditions.
When comparing security programs, account for differences in scope, testing intensity, and reporting practices.
Separate observations from explanations
If a platform reports a 36% increase in a vulnerability category, report that as an observed increase in its dataset.
Do not automatically explain it as a 36% increase in the underlying prevalence of that weakness.
Multiple explanations may fit the observation. Further evidence is needed to distinguish them.
State limitations explicitly
A well-written security report does not become weaker by acknowledging uncertainty.
It becomes more credible.
For example:
"In this dataset, broken access control accounted for 60% of the reviewed reports."
That is a statement about the dataset.
"Broken access control accounts for 60% of all critical web vulnerabilities."
That is a much broader claim and requires much stronger evidence.
8. The question I now ask when reading security research
The lesson from Abraham Wald's aircraft analysis is not that visible evidence should be ignored.
It is that we need to understand why that evidence is visible in the first place.
A returning aircraft, a published vulnerability report, a scanner's successful detection, and an AI security benchmark all provide useful information. The danger arises when we mistake those observations for a complete representation of reality.
As security researchers, we should study successful attacks while accounting for unsuccessful testing. We should compare tools using detection quality as well as finding counts. We should read bug bounty statistics with an understanding of their populations and methodologies. And we should evaluate AI security systems by examining their blind spots, not only their successes.
The next time you see a report claiming that a particular vulnerability is the most common, a scanner is the most effective, or an AI security system has achieved an impressive detection rate, pause and ask:
- What exactly was measured?
- Which observations were excluded?
- How many relevant systems or tests were involved?
- What might the evaluation have failed to detect?
- What evidence would justify generalizing this result?
Sometimes the most valuable insight is not discovering another vulnerability.
It is understanding what the available evidence cannot tell us.
The bugs we see matter. The bugs we miss matter too. And the difference between those two groups can change the conclusions we draw about security.
References
- Wald, Abraham. A Method of Estimating Plane Vulnerability Based on Damage of Survivors. Center for Naval Analyses, 1980 reprint of wartime research. Historical report.
- Mangel, Marc, and Francisco J. Samaniego. Abraham Wald's Work on Aircraft Survivability. Journal of the American Statistical Association, 1984. DOI.
- Bugcrowd. Inside the Mind of a CISO 2025: Resilience in an AI-Accelerated World. September 23, 2025. Official findings and statistics.
- HackerOne. Security Research Report 2026 — 10th Edition. Official report and methodology.
- YesWeHack. The YesWeHack Bug Bounty Report 2025. January 14, 2025. Official report overview.
- Grandjean, Martin; McGeddon. Survivorship-bias.svg. Wikimedia Commons. Image source and license.
Editorial note: Platform statistics reflect their stated datasets, reporting periods, and methodologies. Hypothetical examples are explicitly identified as such. Percentage changes in reported findings should not be interpreted as equivalent changes in the prevalence of vulnerabilities across all systems.